Extracting topics 📚 from
🎗cancer patients’ mutational profiles
Zhi Yang
2019-07-30
About this talk
For those who've never heard of it
❓ what make a topic model (i.e. Latent Dirichlet Allocation)
📚 its general application
For those who know about it
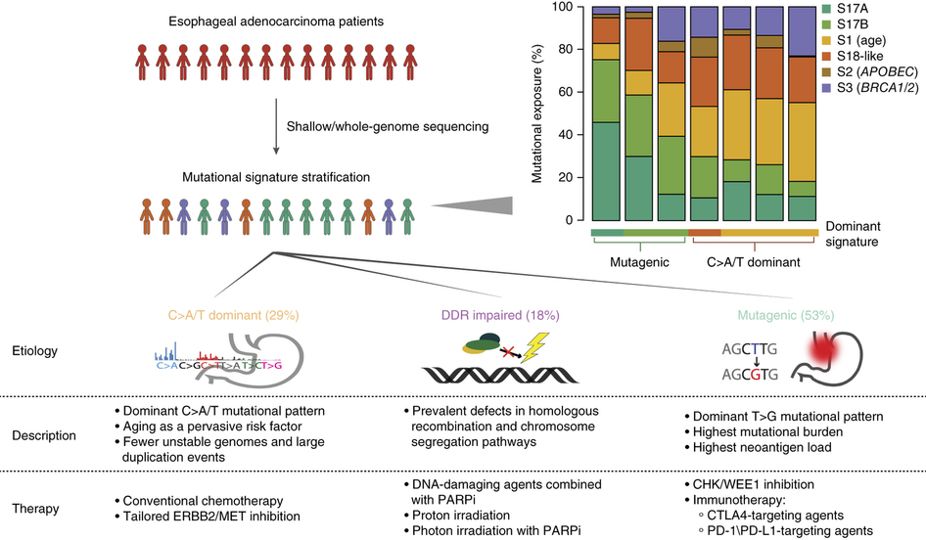
🎗️ Its use in cancer research
📊 data, modeling, software
🏥 medical implications
We usually extract topics from:
books, customer reviews, tweets, ...
scientific journals, medical records, ...
what if they can't be "read"?
We usually extract topics from:
books, customer reviews, tweets, ...
scientific journals, medical records, ...
what if they can't be "read"? 

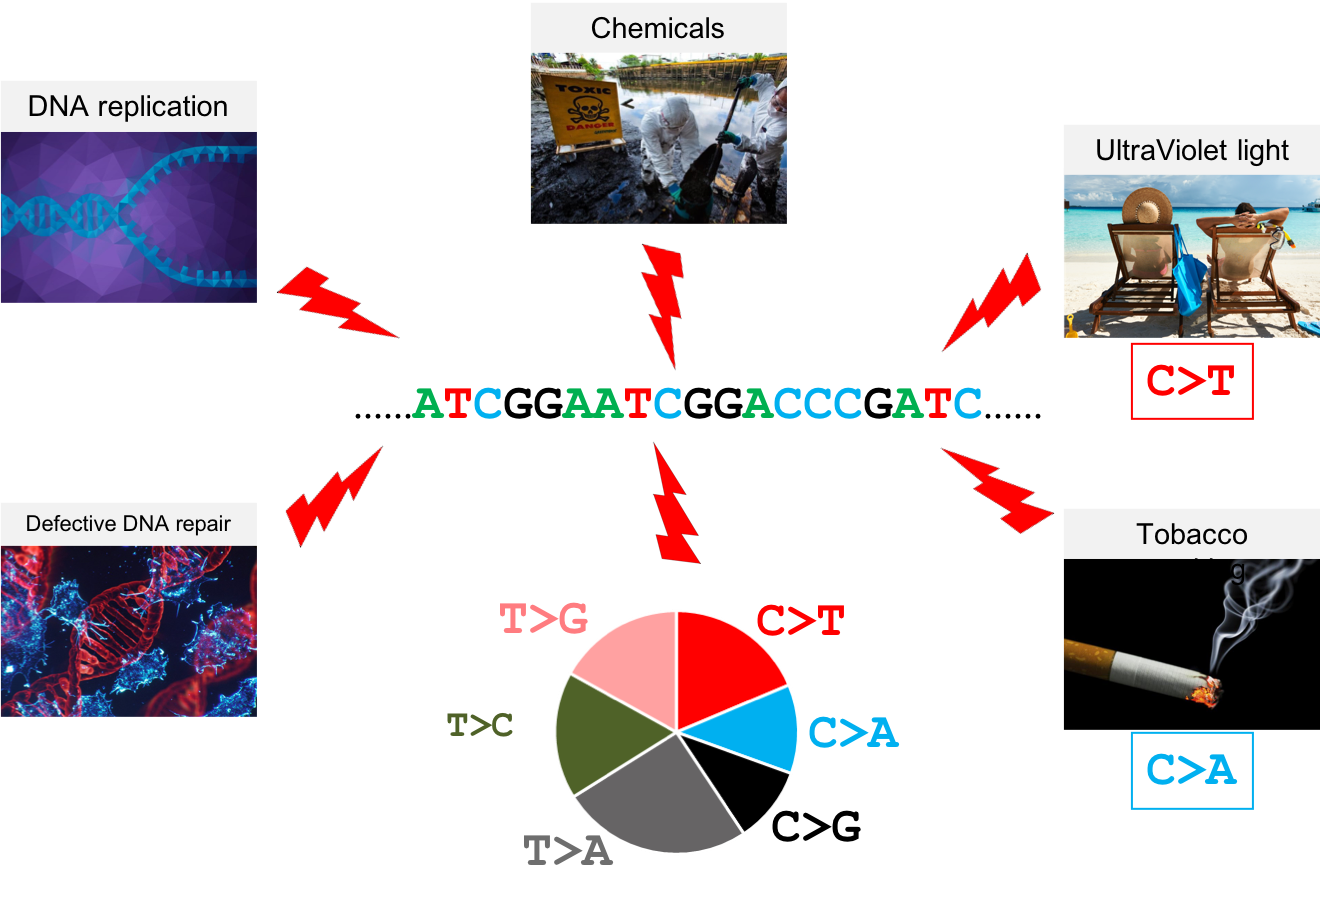
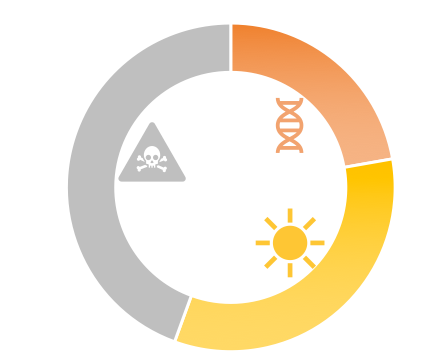
Why studying somatic mutations?
What do we need computers for?
Volume
Velocity
Variety
Variability
Data sources
10,952 exomes
1,048 whole-genomes
40 distinct types of human cancer
The Cancer Genome Atlas (TCGA),the International Cancer Genome Consortium (ICGC), data from peer-reviewed journals
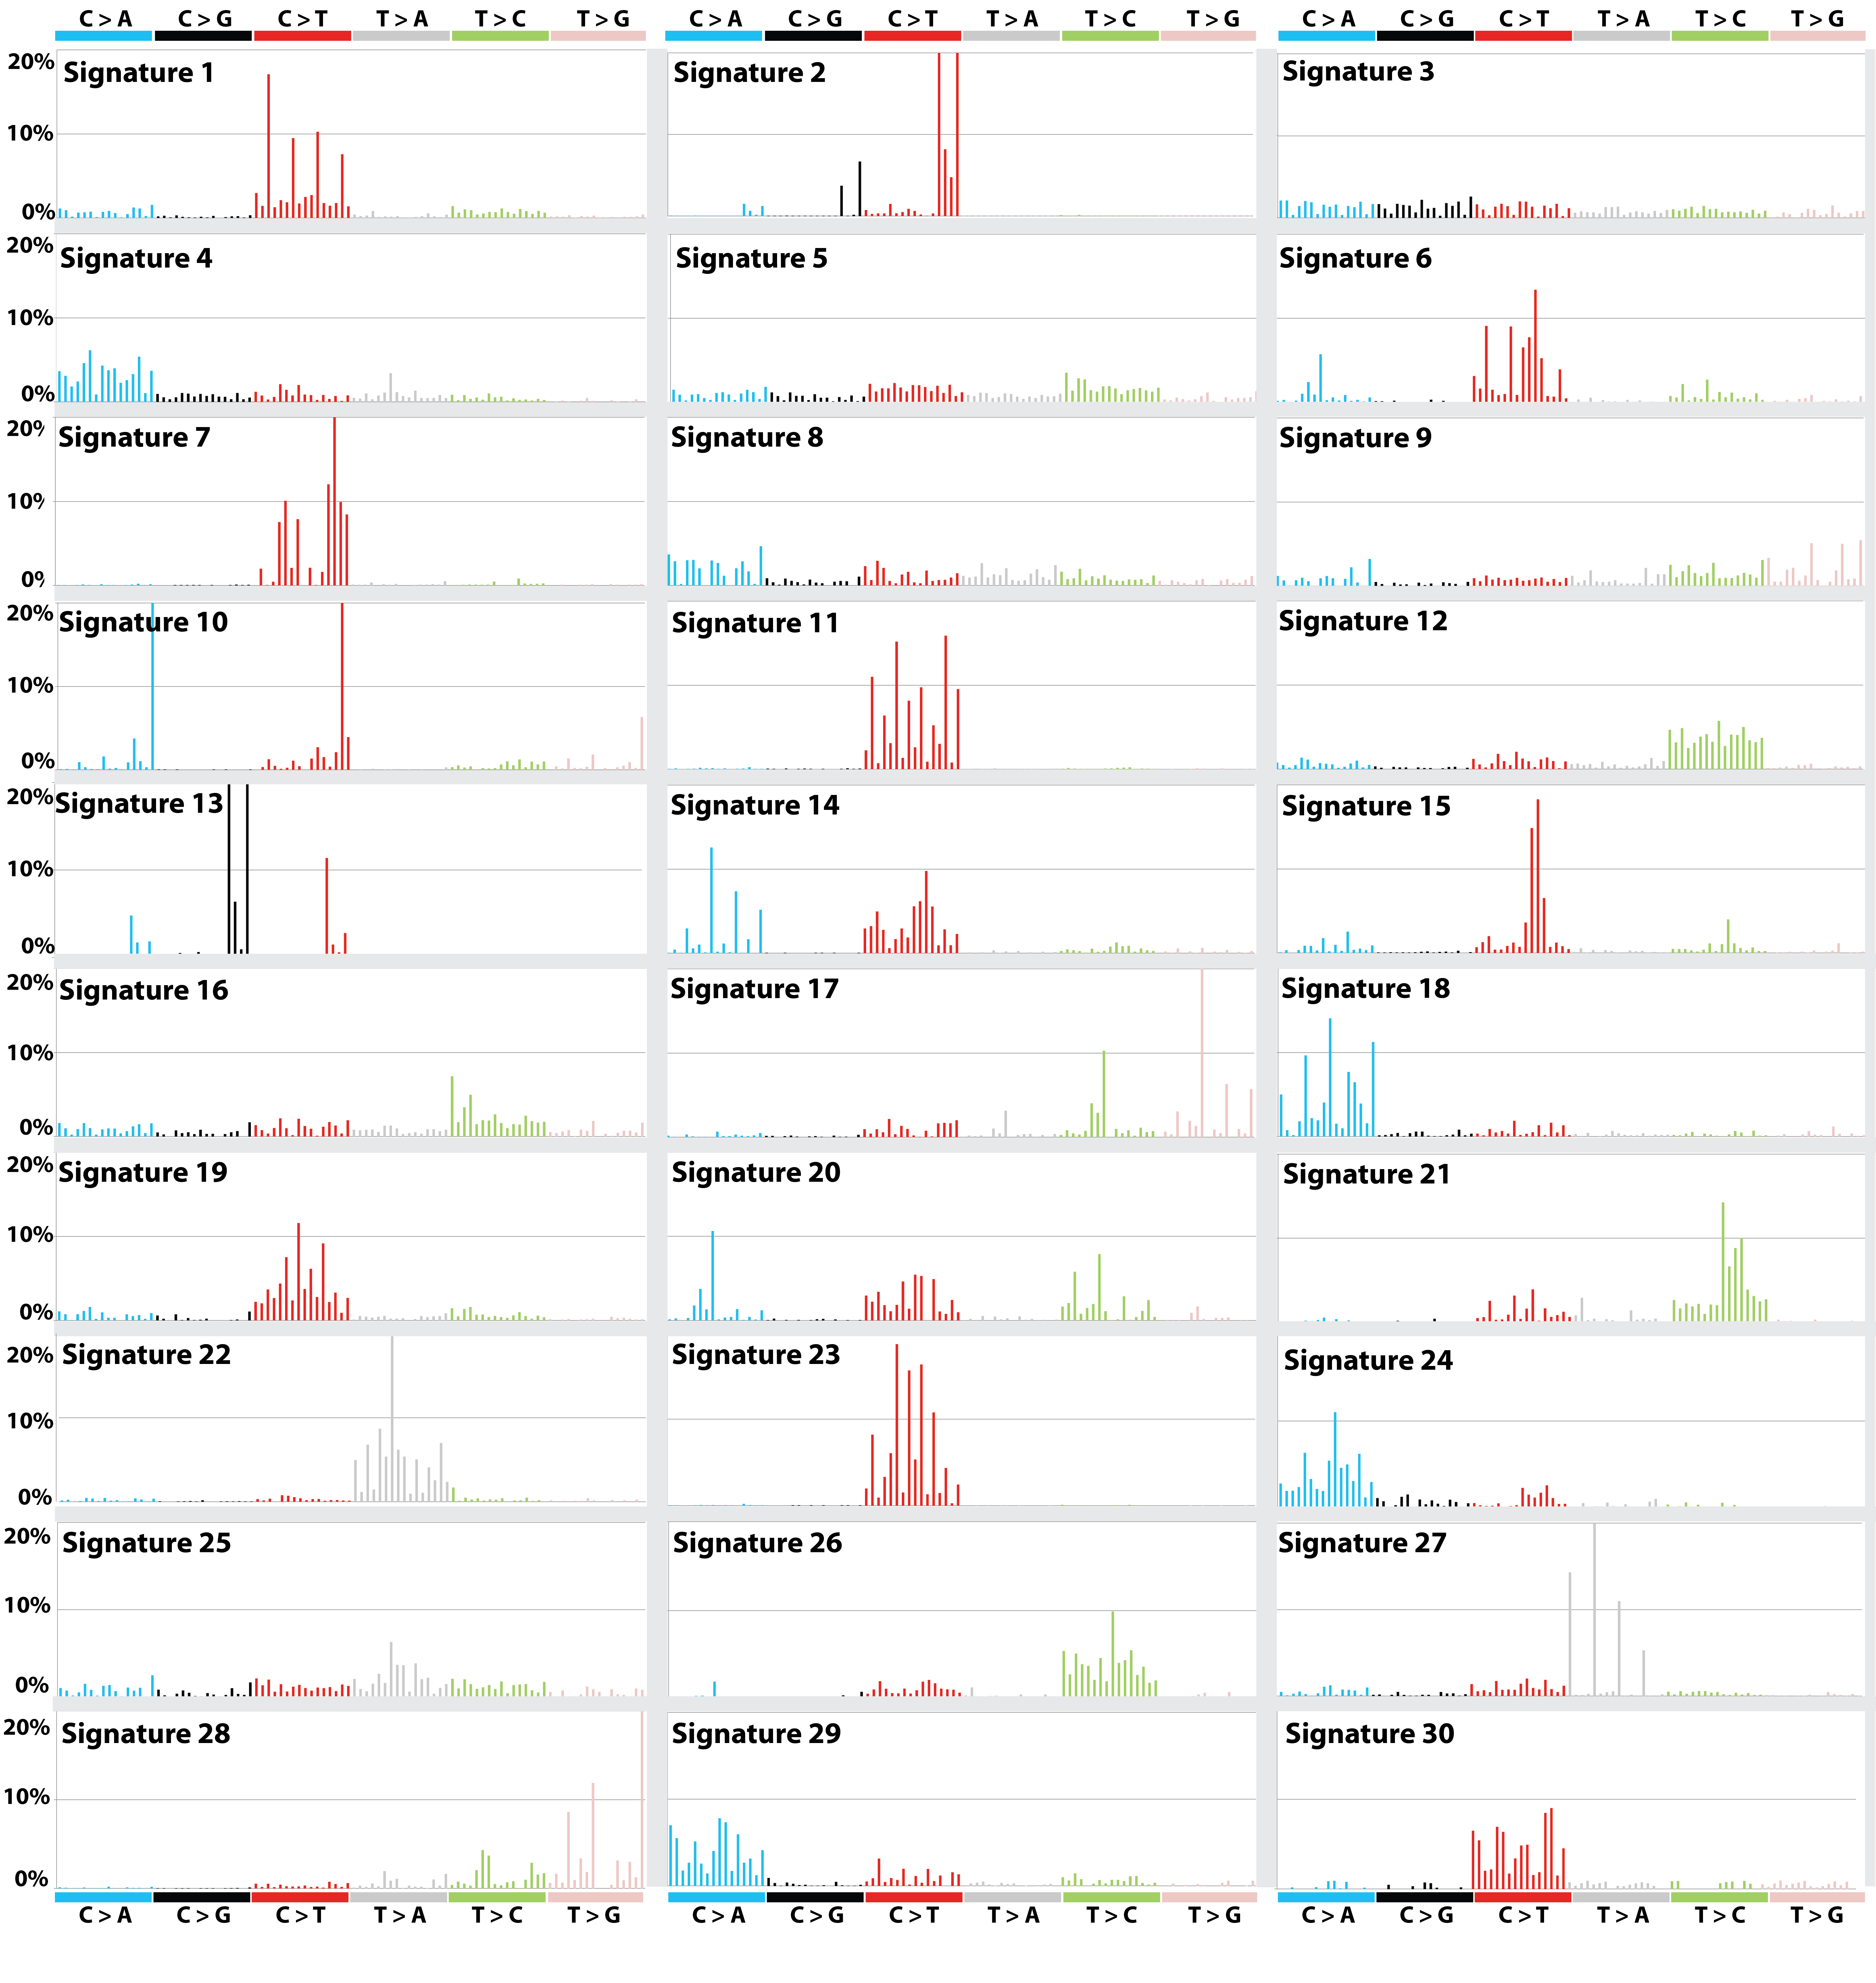
Signatures of Mutational Processes in Human Cancer
What are in a topic model?
documents
topics
words
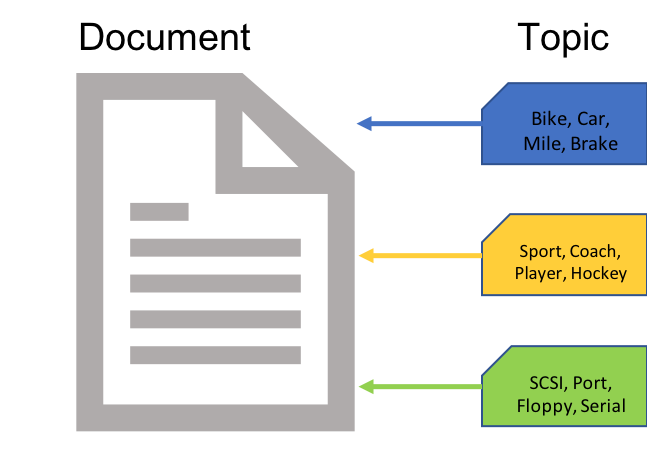
What are in a topic model?
documents
topics --> latent
words

In a single document

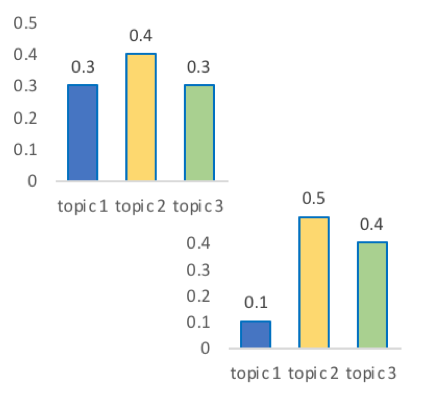
every document is unique
each topic has different fractions,
[0, 1]
In a topic

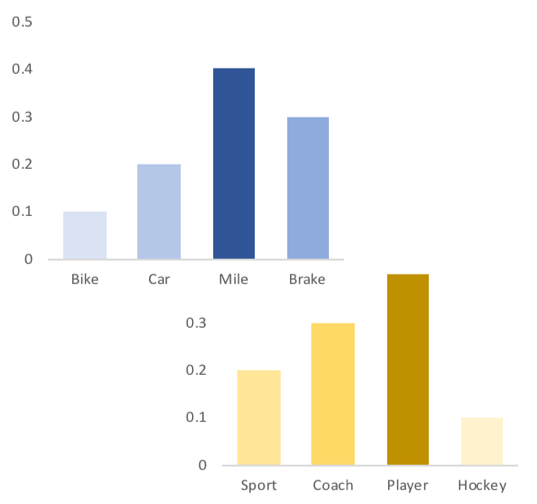
Topics are consistent across documents
choosing the number of topics could be a headache 😟
The hierarchical structure


a single document contains topics with weights
a topic is a unique distribution of words
Data collection

Tissue ➡Sequencing ➡ input
Data collection

Tissue ➡Sequencing ➡ input
| sample | chr | position | ref | alt |
|---|---|---|---|---|
| sample1 | chr1 | 100 | A | C |
| sample1 | chr2 | 100 | G | T |
| sample2 | chr1 | 300 | T | C |
| sample3 | chr3 | 400 | T | C |
Data collection

Tissue ➡Sequencing ➡ input
| sample | chr | position | ref | alt |
|---|---|---|---|---|
| sample1 | chr1 | 100 | A | C |
| sample1 | chr2 | 100 | G | T |
| sample2 | chr1 | 300 | T | C |
| sample3 | chr3 | 400 | T | C |
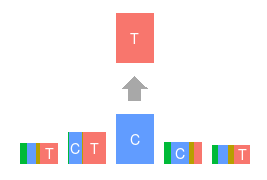
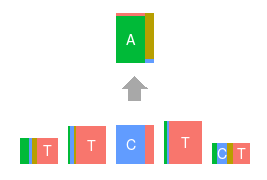
? ? A>C ? ?
G T A>C T C
A glimpse of mutational profiles
 Yang et al. HiLDA: a statistical approach to investigate differences in mutational signatures, 2019
Where are those "words"?

Topics made of mutations
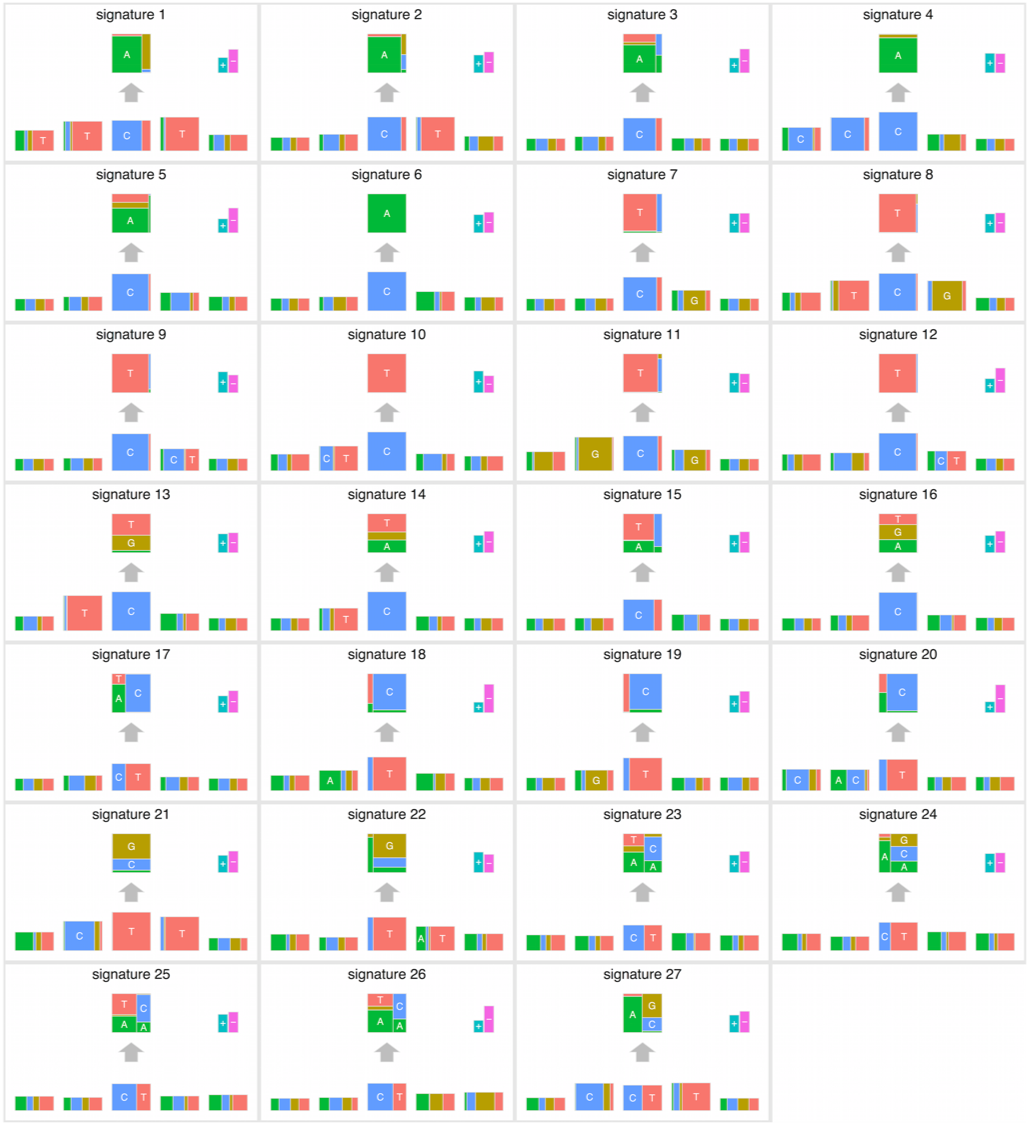
Association with known risk factors
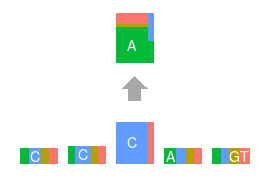


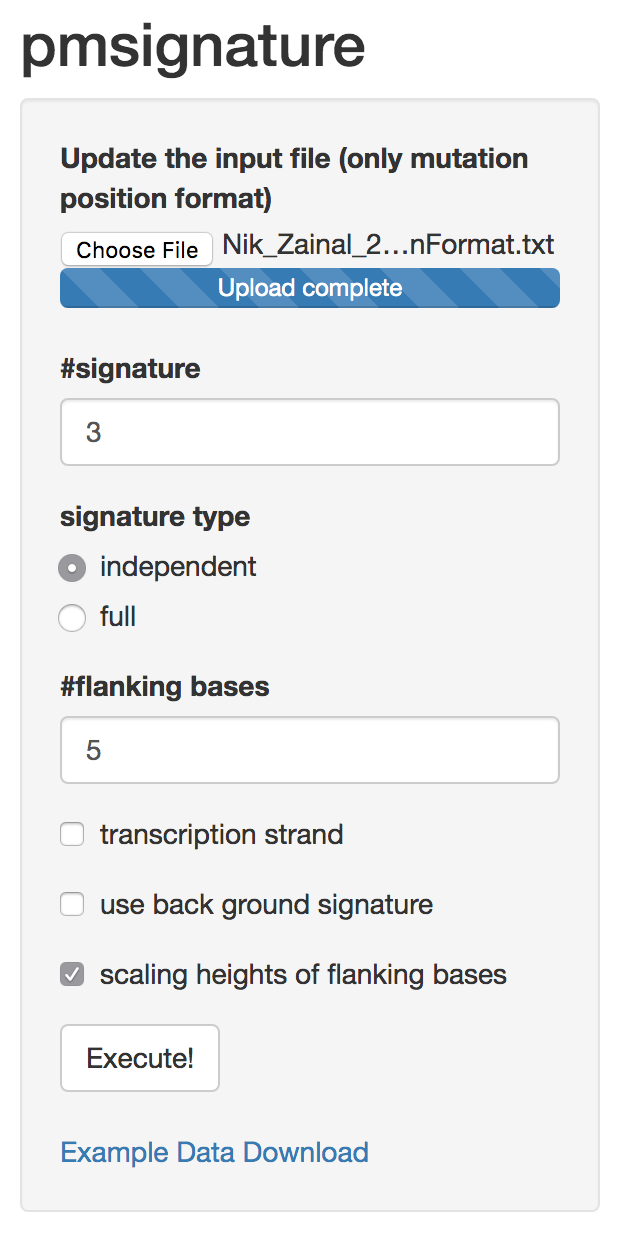
Software implementation
- R package and Shiny app: pmsignature

Hierarchical topic model
documents
topics --> weights
words
After applying the topic model,

Are they different?
Statistical inference
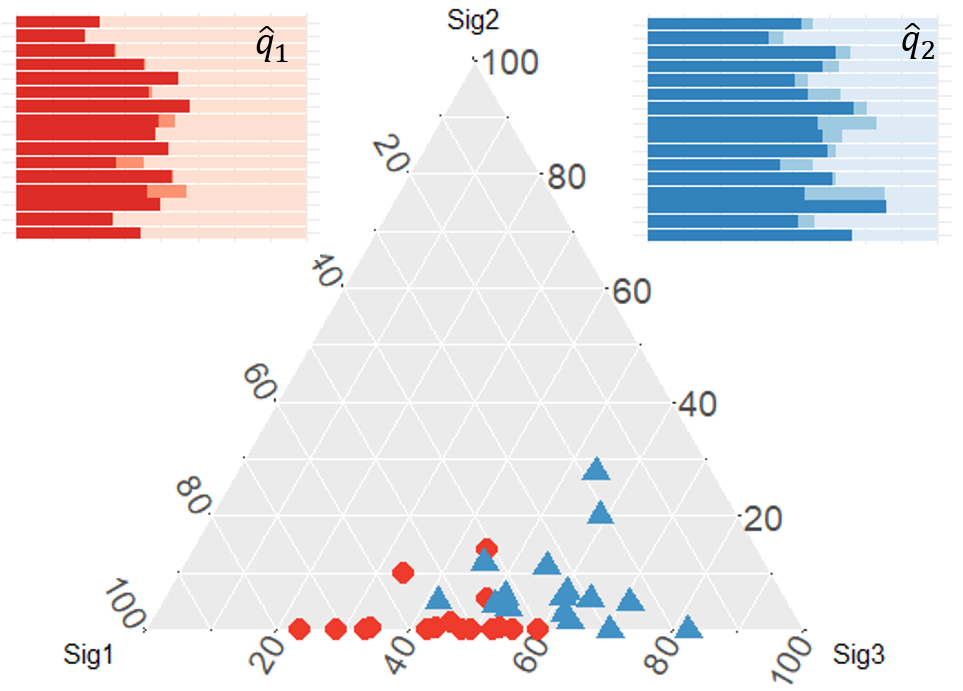
Group differences
fractions pk and concentration parameters αk p1,⋯,pK∼Dirichlet(α1,⋯,αK) μk=αk∑kαk
To capture the group difference for signature i, Δi=μ(1)i−μ(2)i What we'd like to know, H0:Δi=0,i=1,2,...,K
Why don't we just compare the estimated values?
Δi=^μ(1)i−^μ(2)i
A mini GOTB family tree

Why Bayesian?
Why Bayesian?
You learn from the data
Why Bayesian?
You learn from the data
You know the uncertainty of the estimated parameters
My Journey From Frequentist to Bayesian Statistics
JAGS
stands for
Just Another Gibbs Sampler
developed by Martyn Plummer

Why JAGS?
why not WinBUGS 🐞 or Stan?
JAGS vs. WinBUGS
WinBUGS is historically very important with slow development
JAGS vs. WinBUGS
WinBUGS is historically very important with slow development
JAGS has very similar syntax to WinBUGS and it allows cross-platform
JAGS vs. WinBUGS
WinBUGS is historically very important with slow development
JAGS has very similar syntax to WinBUGS and it allows cross-platform
Great interface to R! (rjags, R2jags,runjags)
When there is WinBUGS already, why is JAGS necessary?
JAGS
- longer history with tons of resources 📕📝🎓
- easy to learn and run it
- need to recompile model
- fewer developers
- less viz tools
- various MCMC sampling methods
Stan
- A newer tool with great team/active community
- steeper learning curve
- no need to recompile
- Syntax check in R 😱
- ShinyStan (applicable to JAGS)
- require fewer iterations to converge
Which one's faster? Inconclusive
My situation Stan doesn't support discrete sampling
Why me?
I wrote a part of my dissertation with JAGS
I've repeatedly read through JAGS, WinBUGS manual and numerous journals
I've four years' experiences with searching JAGS examples in Google and GitHub
Installation
Install R
Install RStudio
Install the JAGS from https://sourceforge.net/projects/mcmc-jags/
Install the R2jags package from CRAN:
install.packages("R2jags")library(R2jags)Shiny Demo
The focus of the analysis presented here is on accurately estimating the mean of IQ using simulated data.

https://www.ncbi.nlm.nih.gov/pmc/articles/PMC4158865/
Strong prior vs. weak prior
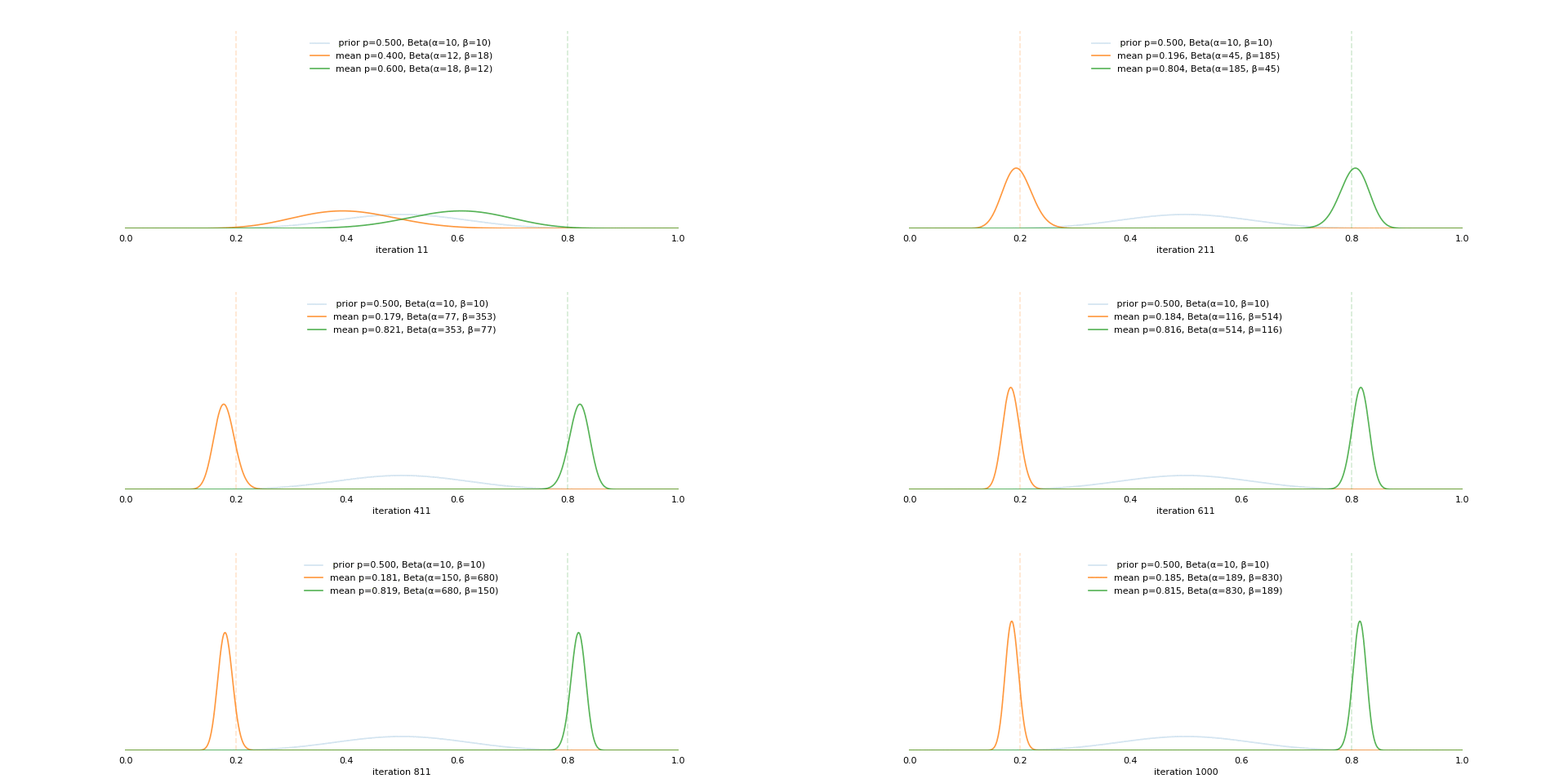
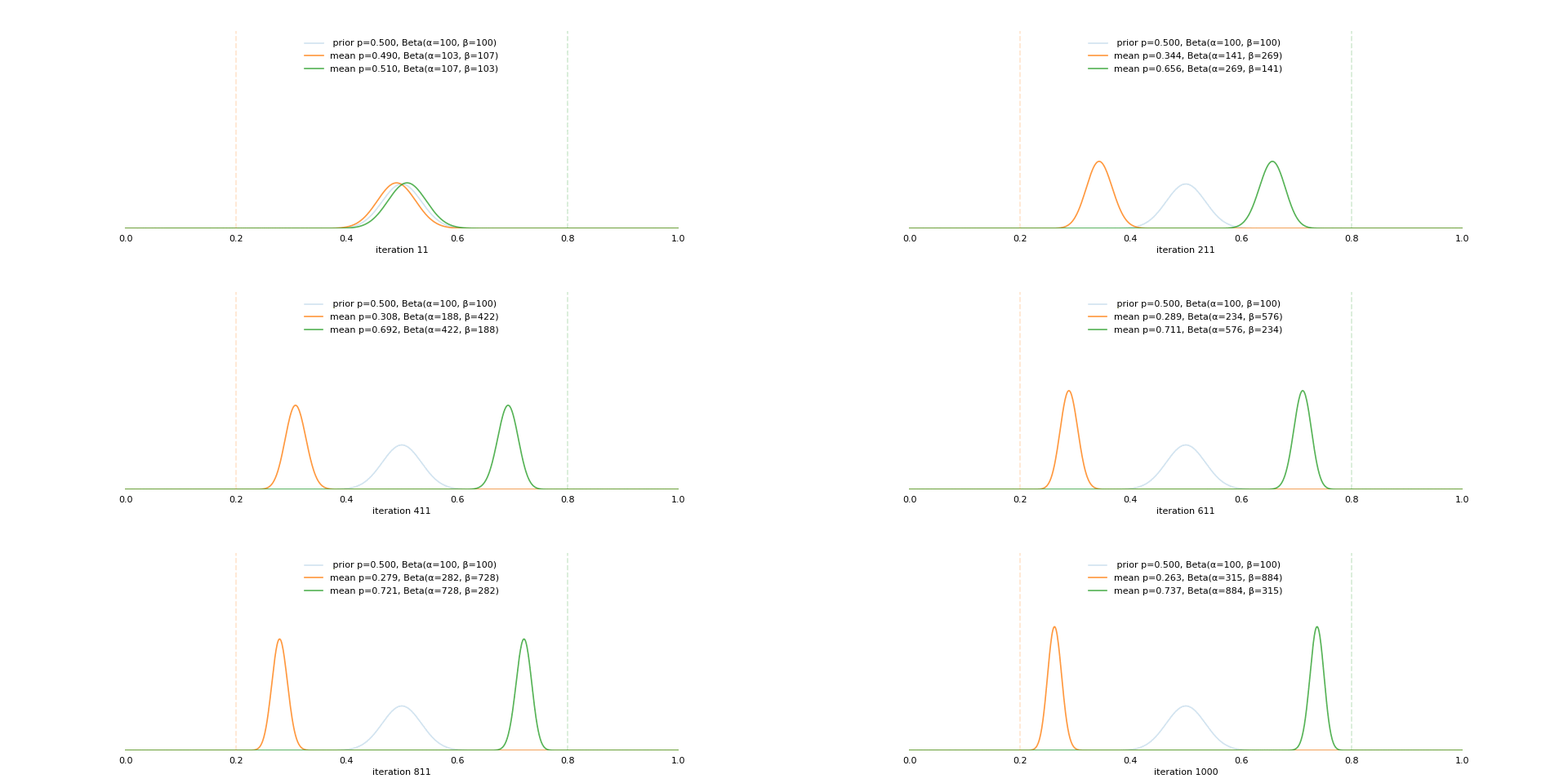
https://towardsdatascience.com/visualizing-beta-distribution-7391c18031f1
Let's get started!
We hold meetings every month and post it on meetup.com, which tells us how many people've signed up, n. But not everyone show up (i.e., traffic). So, we'd like to know what percentage of people, θ, will show up to order enough pizzas.
Yi|θ∼Binom(ni,θ)
θ∼Beta(a,b)
Weak prior:
Beta(1,1)↔Unif(0,1)
Y <- c(77, 62, 30)N <- c(39, 29, 16)Write the model
But as you know, someone (@lukanegoita) said

Write the model
Yi|θ∼Binom(ni,θ)
θ∼Beta(a,b)
In R
model{for(i in 1:3){ Y[i] <- rbinom(1, N[i], theta) } theta <- rbeta(1, 1, 1)}In JAGS
model{for(i in 1:3){ Y[i] ~ dbinom(theta, N[i])} theta ~ dbeta(1, 1)}- A variable should appear only once on the left hand side
- A variable may appear multiple times on the right hand side
- variables that only appear on the right must be supplied as data
Tips on syntax
No need for variable declaration
No need for semi-colons at end of statements
use ddist instead of rdist for random sampling
dnorm(mean, precision) not dnorm(mean, sd)
It allows matrix and array
It is illegal to offer definitions of the variable twice
Write the model
library(R2jags)model_string<-"model{# Likelihoodfor(i in 1:3){ Y[i] ~ dbinom(theta, N[i])}# Prior theta ~ dbeta(1, 1)}"# DataN <- c(77, 62, 30)Y <- c(39, 29, 16)# specify parameters to be moniteredparams <- c("theta")rjags vs. runjags vs. R2jags
R2jags and runjags are just wrappers of rjags
runjags makes it easy to run chains in parallel on multiple processes
R2jags allows running until converged and paralleling MCMC chains
Otherwise, they all have very similar syntax and pre-processing steps
Choosing R2jags
output <- jags(model.file = textConnection(model_string), data = list(Y = Y, N = N), parameters.to.save = params, n.chains = 2, n.iter = 2000)## Compiling model graph## Resolving undeclared variables## Allocating nodes## Graph information:## Observed stochastic nodes: 3## Unobserved stochastic nodes: 1## Total graph size: 8## ## Initializing model## ## | | | 0% | |++ | 4% | |++++ | 8% | |++++++ | 12% | |++++++++ | 16% | |++++++++++ | 20% | |++++++++++++ | 24% | |++++++++++++++ | 28% | |++++++++++++++++ | 32% | |++++++++++++++++++ | 36% | |++++++++++++++++++++ | 40% | |++++++++++++++++++++++ | 44% | |++++++++++++++++++++++++ | 48% | |++++++++++++++++++++++++++ | 52% | |++++++++++++++++++++++++++++ | 56% | |++++++++++++++++++++++++++++++ | 60% | |++++++++++++++++++++++++++++++++ | 64% | |++++++++++++++++++++++++++++++++++ | 68% | |++++++++++++++++++++++++++++++++++++ | 72% | |++++++++++++++++++++++++++++++++++++++ | 76% | |++++++++++++++++++++++++++++++++++++++++ | 80% | |++++++++++++++++++++++++++++++++++++++++++ | 84% | |++++++++++++++++++++++++++++++++++++++++++++ | 88% | |++++++++++++++++++++++++++++++++++++++++++++++ | 92% | |++++++++++++++++++++++++++++++++++++++++++++++++ | 96% | |++++++++++++++++++++++++++++++++++++++++++++++++++| 100%## | | | 0% | |** | 4% | |**** | 8% | |****** | 12% | |******** | 16% | |********** | 20% | |************ | 24% | |************** | 28% | |**************** | 32% | |****************** | 36% | |******************** | 40% | |********************** | 44% | |************************ | 48% | |************************** | 52% | |**************************** | 56% | |****************************** | 60% | |******************************** | 64% | |********************************** | 68% | |************************************ | 72% | |************************************** | 76% | |**************************************** | 80% | |****************************************** | 84% | |******************************************** | 88% | |********************************************** | 92% | |************************************************ | 96% | |**************************************************| 100%## Compiling model graph## Resolving undeclared variables## Allocating nodes## Graph information:## Observed stochastic nodes: 3## Unobserved stochastic nodes: 1## Total graph size: 9## ## Initializing model## ## | | | 0% | |++ | 4% | |++++ | 8% | |++++++ | 12% | |++++++++ | 16% | |++++++++++ | 20% | |++++++++++++ | 24% | |++++++++++++++ | 28% | |++++++++++++++++ | 32% | |++++++++++++++++++ | 36% | |++++++++++++++++++++ | 40% | |++++++++++++++++++++++ | 44% | |++++++++++++++++++++++++ | 48% | |++++++++++++++++++++++++++ | 52% | |++++++++++++++++++++++++++++ | 56% | |++++++++++++++++++++++++++++++ | 60% | |++++++++++++++++++++++++++++++++ | 64% | |++++++++++++++++++++++++++++++++++ | 68% | |++++++++++++++++++++++++++++++++++++ | 72% | |++++++++++++++++++++++++++++++++++++++ | 76% | |++++++++++++++++++++++++++++++++++++++++ | 80% | |++++++++++++++++++++++++++++++++++++++++++ | 84% | |++++++++++++++++++++++++++++++++++++++++++++ | 88% | |++++++++++++++++++++++++++++++++++++++++++++++ | 92% | |++++++++++++++++++++++++++++++++++++++++++++++++ | 96% | |++++++++++++++++++++++++++++++++++++++++++++++++++| 100%## | | | 0% | |** | 4% | |**** | 8% | |****** | 12% | |******** | 16% | |********** | 20% | |************ | 24% | |************** | 28% | |**************** | 32% | |****************** | 36% | |******************** | 40% | |********************** | 44% | |************************ | 48% | |************************** | 52% | |**************************** | 56% | |****************************** | 60% | |******************************** | 64% | |********************************** | 68% | |************************************ | 72% | |************************************** | 76% | |**************************************** | 80% | |****************************************** | 84% | |******************************************** | 88% | |********************************************** | 92% | |************************************************ | 96% | |**************************************************| 100%Visualizing output
plot(as.mcmc(output))
Visualizing output
library(mcmcplots)mcmcplot(as.mcmc(output),c("theta"))denplot(as.mcmc(output),c("theta"))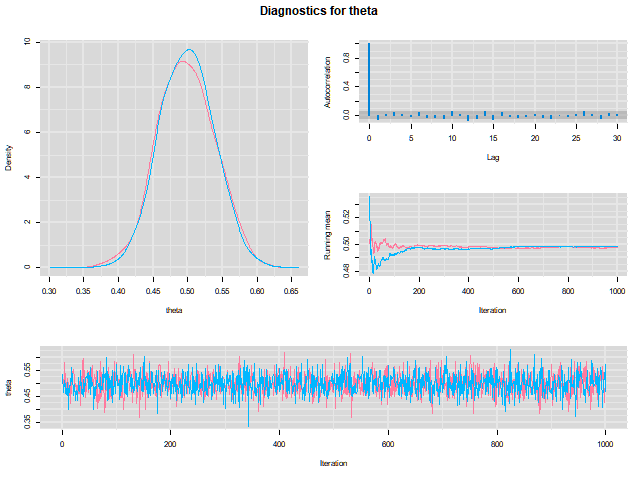
Model diagnostic
So it might take a longer time for run

Model diagnostic and convergence
output$BUGSoutput$summary## mean sd 2.5% 25% 50% 75%## deviance 14.6755846 1.3992791 13.6488245 13.7614902 14.1370965 15.0345916## theta 0.4973384 0.0388237 0.4187856 0.4710636 0.4970235 0.5249785## 97.5% Rhat n.eff## deviance 18.7558006 1.017801 220## theta 0.5720824 1.003696 2000If it fails to converge, we can do the following,
update(output, n.iter = 1000)autojags(output, n.iter = 1000, Rhat = 1.05, n.update = 2)weak prior vs. strong prior
output$BUGSoutput$summary## mean sd 2.5% 25% 50% 75%## deviance 14.6755846 1.3992791 13.6488245 13.7614902 14.1370965 15.0345916## theta 0.4973384 0.0388237 0.4187856 0.4710636 0.4970235 0.5249785## 97.5% Rhat n.eff## deviance 18.7558006 1.017801 220## theta 0.5720824 1.003696 2000output2$BUGSoutput$summary## mean sd 2.5% 25% 50% 75%## deviance 15.2841452 1.77163845 13.6509996 13.9603596 14.6893500 16.0268236## theta 0.5357841 0.02994589 0.4754806 0.5161242 0.5361084 0.5560317## 97.5% Rhat n.eff## deviance 20.0407688 1.005639 490## theta 0.5934454 1.002685 690weak prior vs. strong prior
denplot(as.mcmc(output), parms = "theta", xlim = c(0.3, 0.7))
denplot(as.mcmc(output2), parms = "theta", xlim = c(0.3, 0.7))
Linear regression
In JAGS
model<-"model{# Likelihoodfor(i in 1:N){ y[i] ~ dnorm(mu[i], tau) mu[i] <- beta0 + beta1*x[i]}# Prior # intercept beta0 ~ dnorm(0, 0.0001) # slope beta1 ~ dnorm(0, 0.0001) # error term tau ~ dgamma(0.01, 0.01) sigma <- 1/sqrt(tau)}"lm_output <- jags(model.file = textConnection(model), data = list(y = y, x = x, N=15), parameters.to.save = c("beta0","beta1", "sigma"), n.chains = 2, n.iter = 2000, progress.bar ="none")In R
lm(y~x)In statistics 101
Yi=b0+b1Xi+σ Y∼N(b0+b1X,σ2)
## Compiling model graph## Resolving undeclared variables## Allocating nodes## Graph information:## Observed stochastic nodes: 15## Unobserved stochastic nodes: 3## Total graph size: 70## ## Initializing modelInterpretation
In JAGS
lm_output$BUGSoutput$summary[1:2, c(3,7)]## 2.5% 97.5%## beta0 -8.853992 52.131691## beta1 -16.496277 3.19287395% credible interval
In R
confint(lm(y~x))## 2.5 % 97.5 %## (Intercept) -9.32782 51.322335## x -16.19329 3.48652895% confidence interval
An alternative way
In runjags
model <- template.jags( y ~ x, data, n.chains=2, family='gaussian')In R
lm(y~x)About sources 📕+💻
If you've got 2hrs:
- useR! International R User 2017 Conference JAGS workshop by Martyn Plummer <-- 👨 of JAGS
If you've got 5 mins:
RJAGS: how to get started by Rens van de Schoot, retweeted by Martyn Plummer
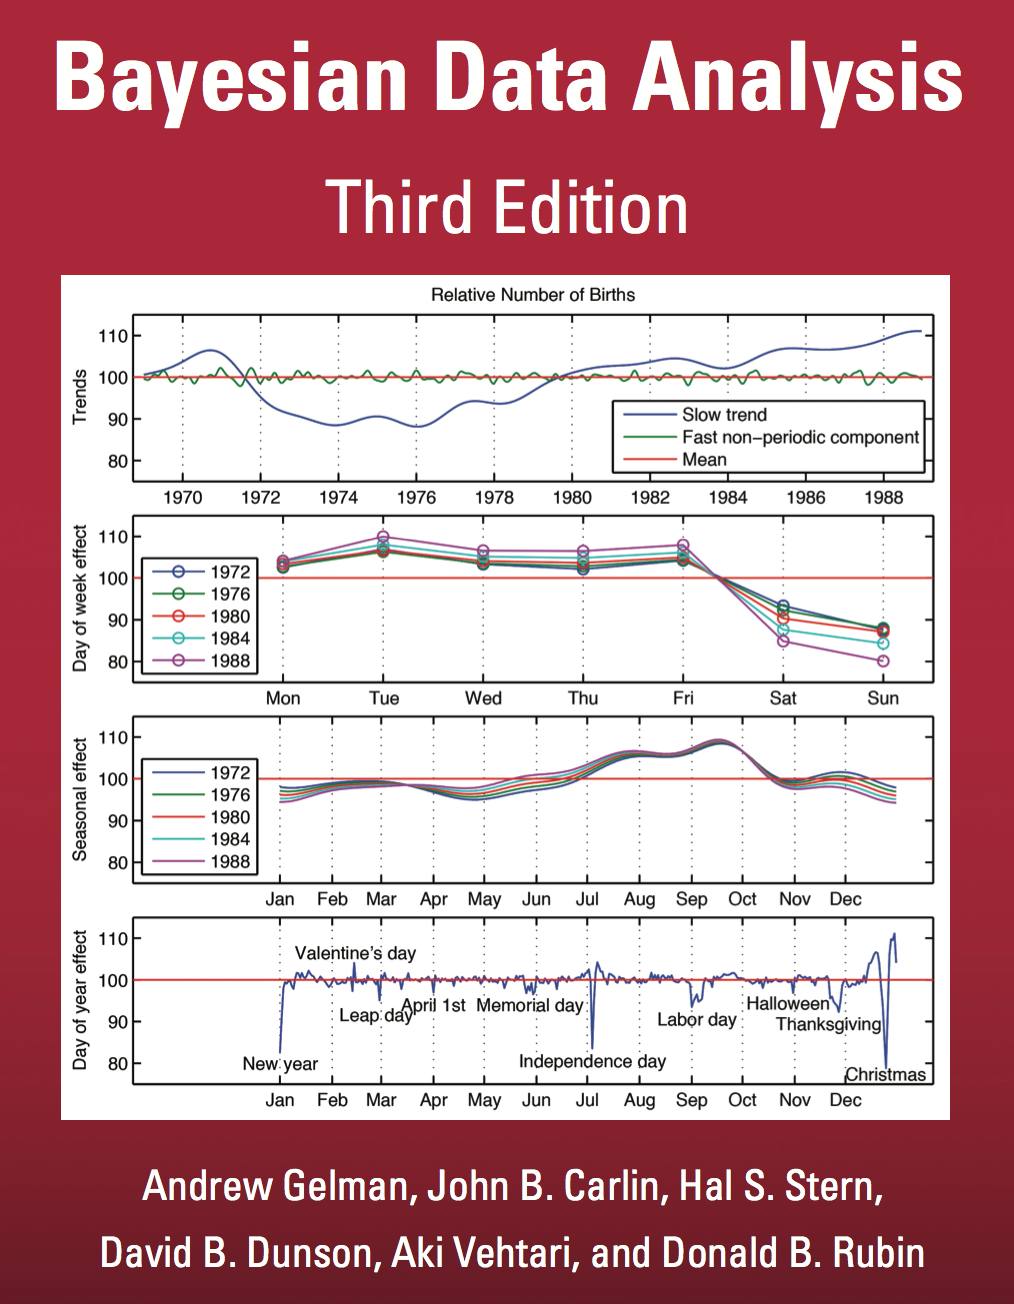
If you're a book lover:

What about puppies?
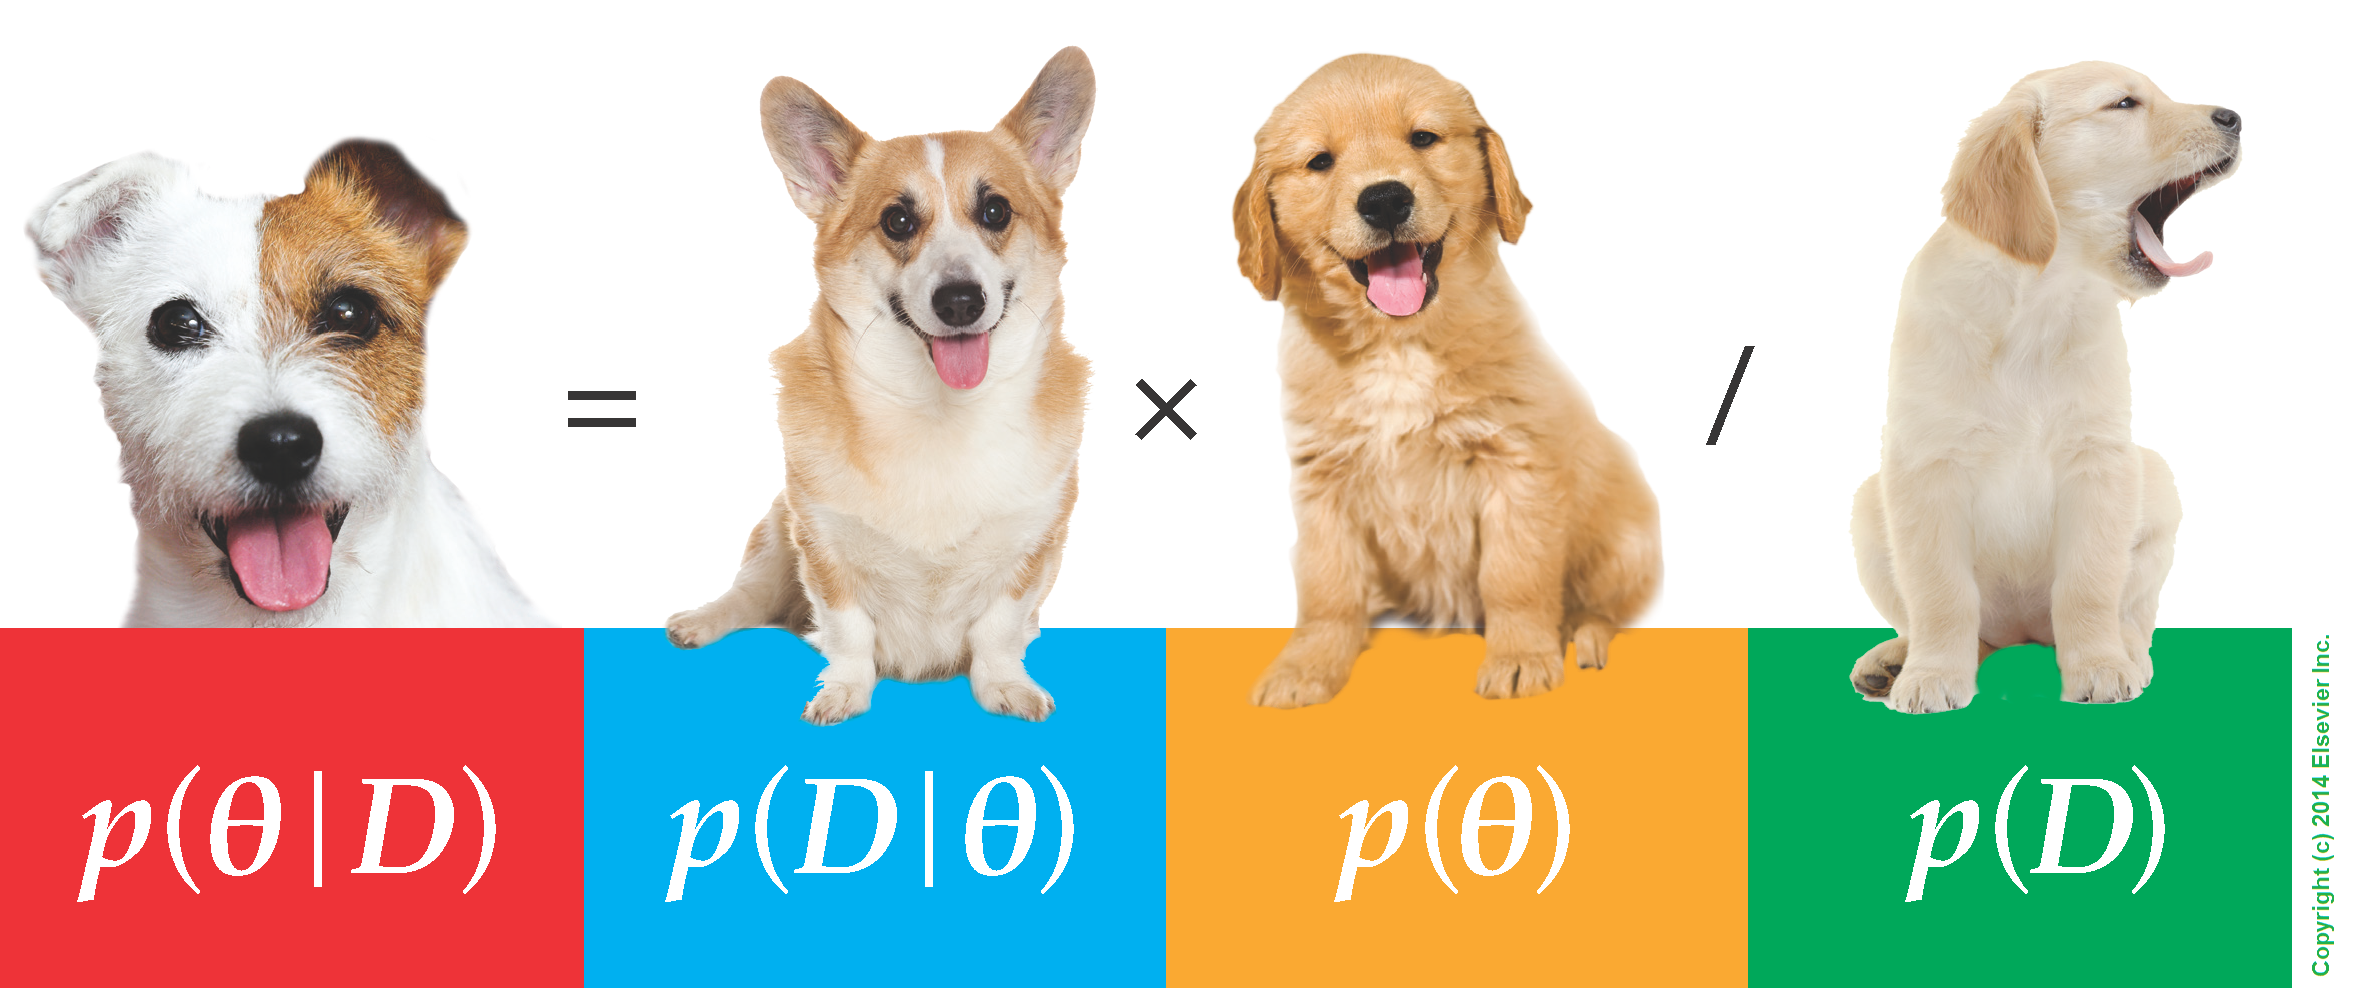
"perky ears" + "floppy ears" ?= "half-up ears"
Thanks! and Keep in touch
Slides: https://lda-mutations.netlify.com/
@zhiiiyang zhiiiyang zyang895@gmail.com
Slides created via the R package xaringan and xaringanthemer


